ISIN INF760K01JQ6
Overall analysis
1-yr rolling excess returns has given higher returns against benchmark and TE ranges between 4-6% but it is decreasing every month. The funds performance in the short run has been impressive. The fund had given the excess return in comparison to its peers, which shows its potential.
Performance analysis
Rolling returns in quartiles
The rolling return chart shows excess 3-year annualised returns in context of peer return quartiles. The blue line’s time above the third green median line indicates the fund’s better than median performance.

The funds rolling return chart shows that the fund crosses the third green median line which indicates the fund is better than median performance. In April-2023, the fund gave the highest 1Y-Rolling Return of 5.24%.
Rolling risk/return (Snail-trail)
The rolling risk/return chart shows excess 3-year annualised returns relative to the index. The top left quadrant would indicate higher returns with lower volatility than index.

This fund has shown impressive 1-year excess returns, touching 5.24% per annum with a risk of -0.636%. However, the excess return came down to around -0.82% towards the end of 2022.
Tracking error
The tracking error chart shows how the fund ‘tracks’ against the index. The higher the TE, the more active the fund’s return has been, with the 2-4% range considered to be barely active, 4-6% range considered to be reasonably active and anything higher attributed to concentrated/focused funds. Funds with TE of less than 2% can be considered to be closet indexers.

Tracking Error of the fund has been good which was around 3-6%. It shows that this fund is Moderately Active.
Information ratio
The information ratio is a measure of ‘risk-adjusted return’ as it’s the excess return per unit of excess volatility. Active funds should have IR of higher than 1, ideally higher than 1.3 at least to indicate skill.

The information ratio of the fund of 1Y-IR shows neutral at starting but on Mar-2023 it went around 1.24.
Portfolio analysis
Stock style chart
Morningstar’s stock style chart shows the ‘style’ of the stocks in the portfolio in terms of size and value/growth style. The centroid shows the weighted average while the zone circle shows how varied the stock styles are.
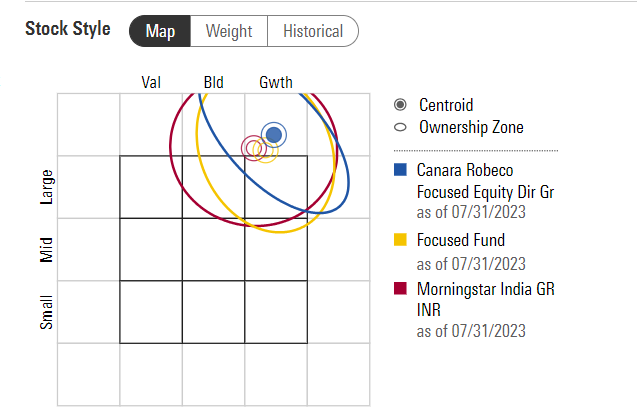
The Stock Style chart of the fund shows the fund is a large cap growth fund.
Prepared by – Ashutosh Sahu, August 2023
You must be logged in to post a comment.