ISIN INF846K01DD4
Performance analysis
Rolling returns in quartiles
The 3-year rolling excess median return has gradually come down from around 0.57% from May 2016 to -0.20% in April 2023. The dispersion between upper and lower quartile is still wide at +1.58% and -1.67% pa.
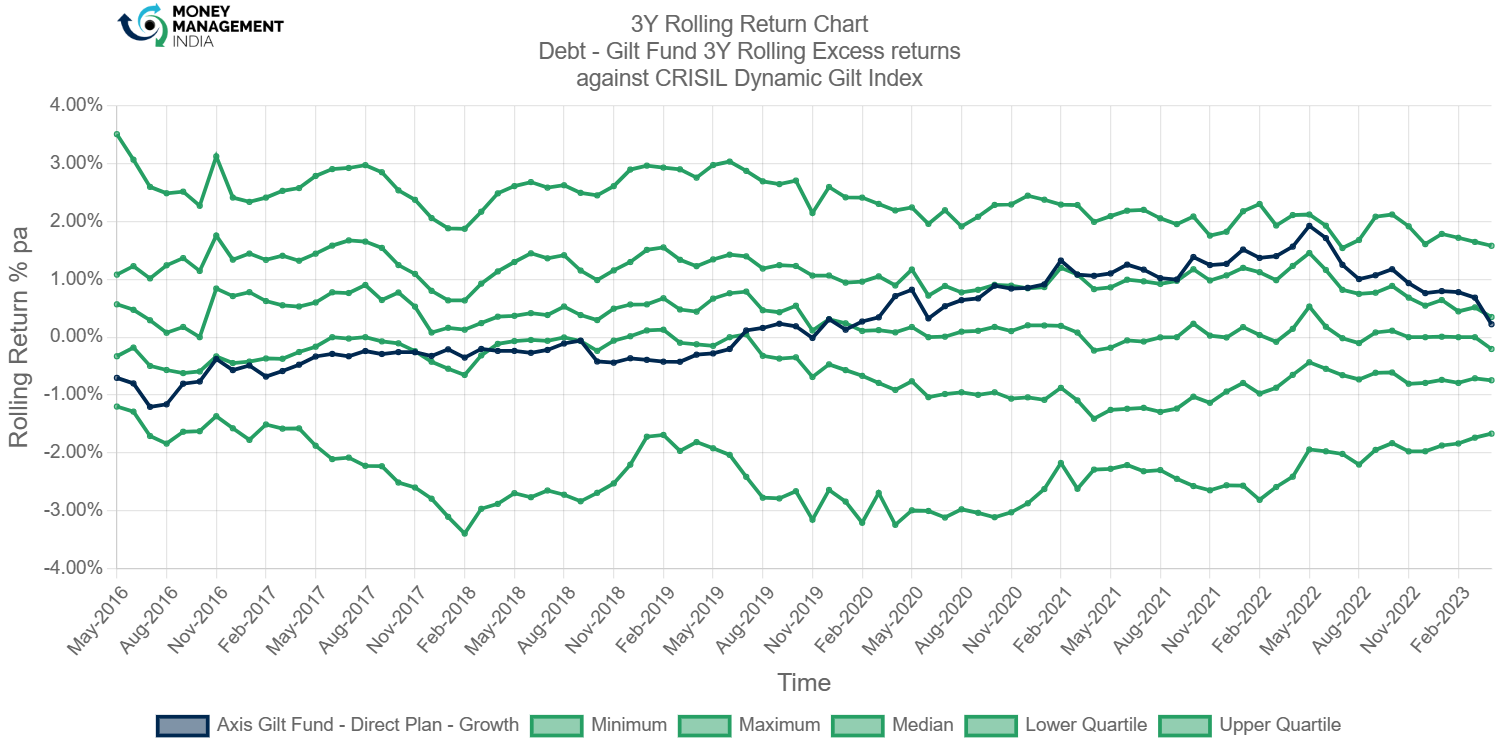
The rolling return chart shows that the fund gave negative returns between May 2016 to June 2019. From July 2019, the fund started giving positive returns, the peak being at 2% per annum in May 2022. However, in April 2023, the returns came down to 0.22% per annum.
Rolling risk/return (Snail-trail)
Funds in this category have shown slightly higher (-2 to +1.8) standard deviation compared to the volatility of the index.
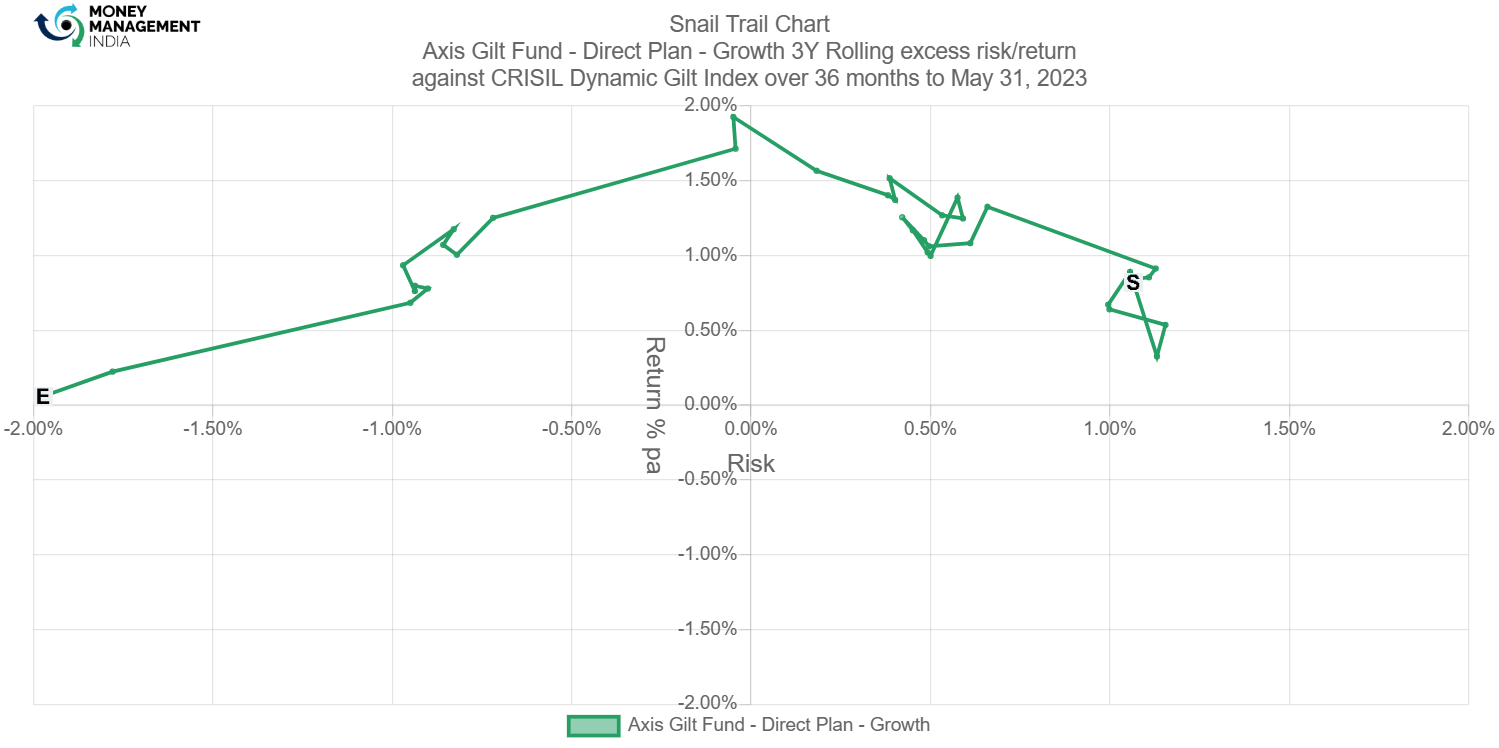
The fund has shown 3 – year excess returns touching 2% per annum and a significant time around 1.5% to 1% per annum, whilst higher than the index volatility of around 0.5% per annum. However, in May 2023, the excess returns came down to around 0.2% with a lower than the index volatility of around -2%.
Tracking error
The tracking error ranges between 2.60% to 0.60% for the period May 2020 to May 2023.

In Dec 2022, the tracking error was the highest at 2.16%. However, in May 2023, the tracking error came down to 1.1%. Overall the tracking error has been above 1%.
Information ratio
The rolling IR has been quite volatile ranging from -2.5 to 3 making it difficult to discern any skill.
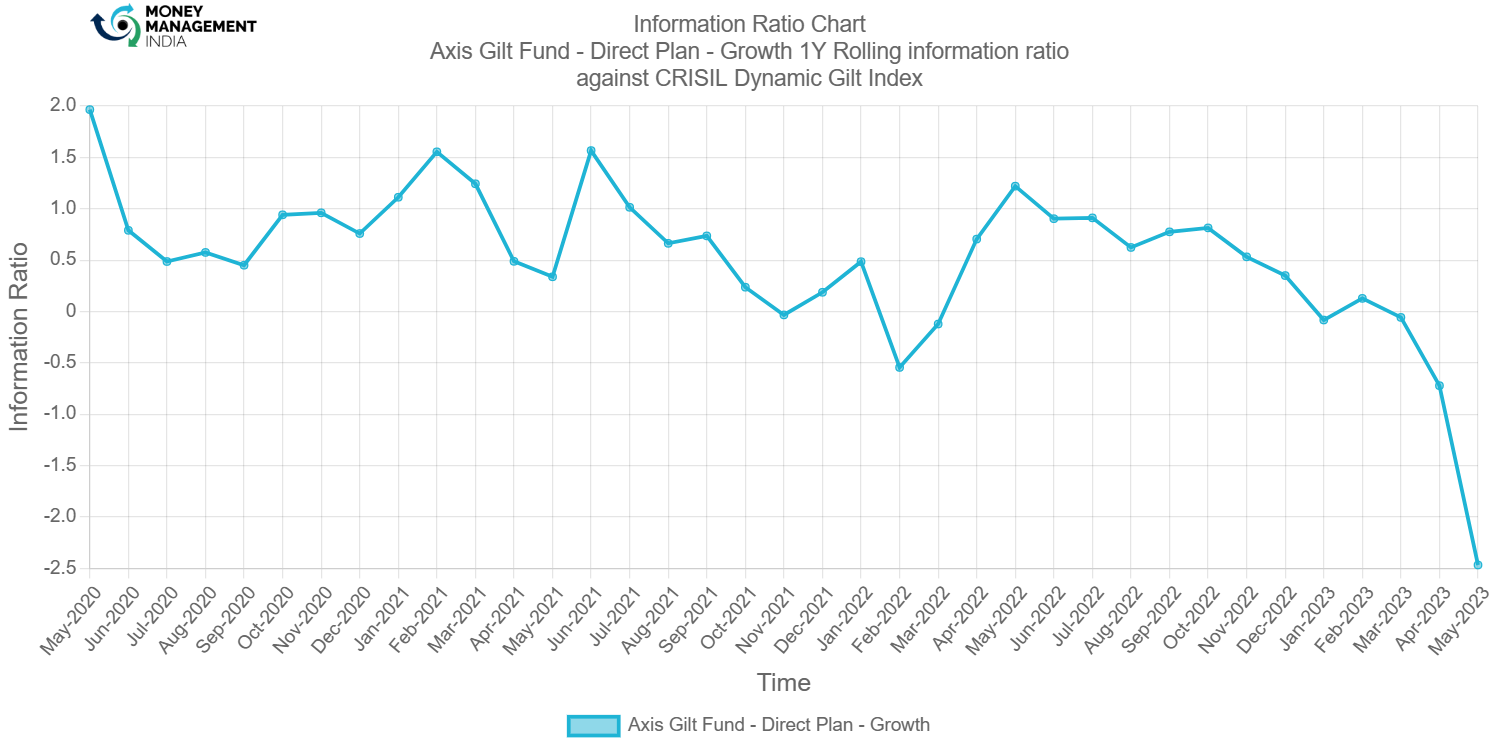
In May 2020, the information ratio was at its peak at 2. However, in May 2023, the ratio came down to -2.4. The information ratio for the fund has mostly been above 0.5. The overall range has been around 2 to -0.5.
Prepared by – Oraina Dsouza, June 2023
You must be logged in to post a comment.