INF846K01K68
Overall analysis (h2)
3-yr rolling excess returns is poor because the fund has generated negative returns, it has crossed down the median, lower quartile & minimum which is a worst-case scenario compared to its peers. It has negative risk & return, Fund is moderately active with a TE of 4.27%, It has got negative IR which is again a bad sign.
Performance analysis (h2)
Rolling returns – 3 years rolling excess returns
Snail trail – 3 years rolling excess risk/return
Tracking error – 1 year rolling tracking error over 3 years
Information ratio – 1 year rolling information ratio over 3 years
Rolling returns in quartiles
The rolling return chart shows excess 1Y-year rolling return in context of peer return quartiles. The blue line’s time above the third green median line indicates the fund’s better than median performance.
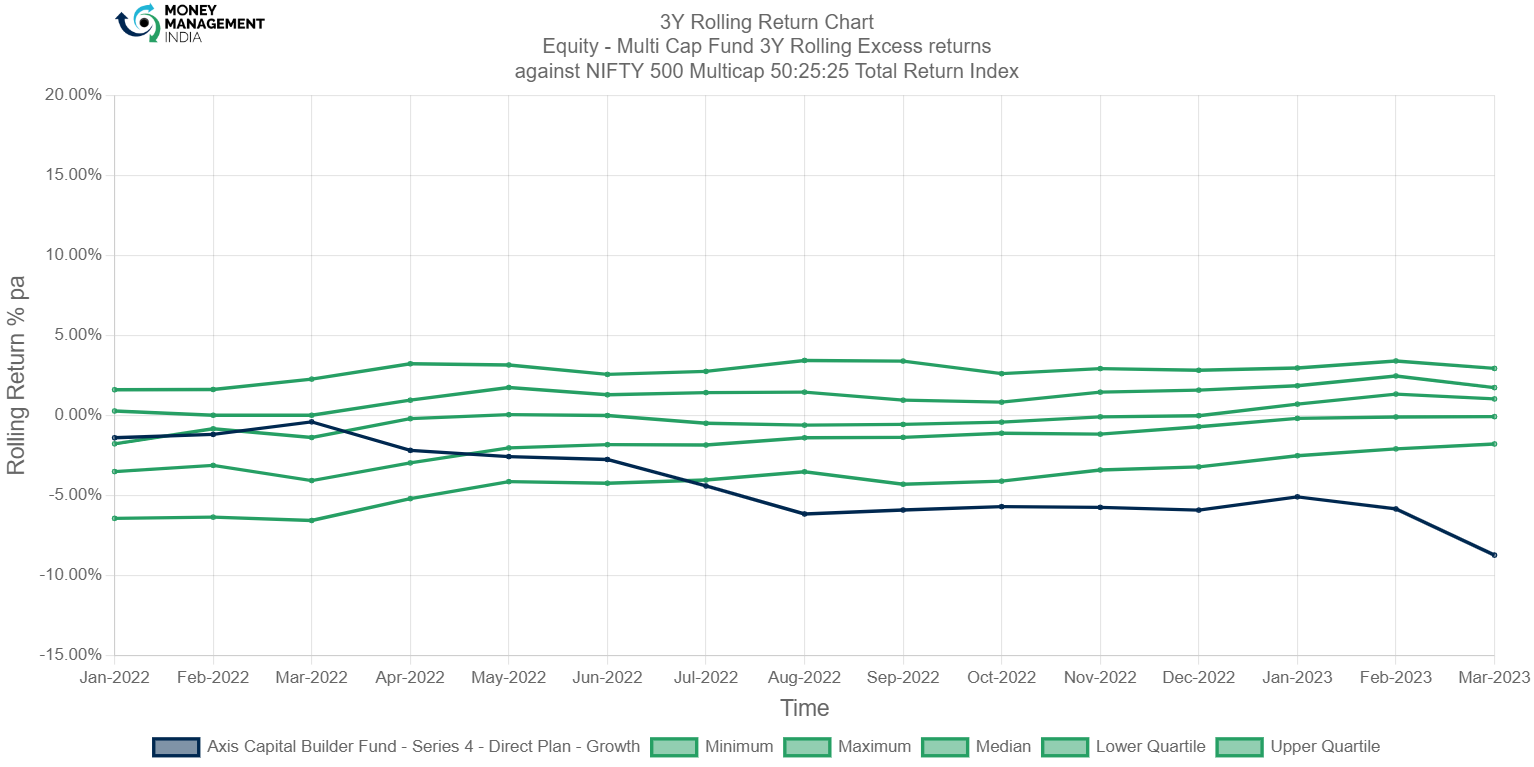
Overall, the fund is persistently generating negative returns since January 2022. This rolling return chart shows that the fund is struggling around Median, lower quartile & minimum line & has many crossovers through these three lines. It has the highest negative return of (-8.72%) & lowest negative return of
(-0.40%).
Rolling risk/return (Snail-trail)
The rolling risk/return chart shows excess 1-year annualized returns relative to the index. The top left quadrant would indicate higher returns with lower volatility than index.

The snail trail chart is not great, it is in harmful section of the chart. The fund has always been in the negative excess return with negative risk. Though negative excess return is not a great result for a mutual fund.
Tracking error
The tracking error chart shows how the fund ‘tracks’ against the index. The higher the TE, the more active the fund’s return has been, with the 1-3% range considered to be low TE, 3-6% range considered to be moderately active and anything higher than 6% is high TE. Funds with TE of less than 2% can be considered to be closet indexers.

This fund had high tracking error, till September 2021 the portfolio was highly active & further it was moderately active, as per the recent data TE stands at 4.27% as of march 2023.
Information ratio
The information ratio is a measure of ‘risk-adjusted return’ as it’s the excess return per unit of excess volatility. Active funds should have IR of higher than 1, ideally higher than 1.3 at least to indicate skill.

Information ratio of this fund is below 1 most of the time throughout the chart, this fund was highly active in march 2020 when IR touched 2.26 & currently IR is in negative i.e., -0.4.
Prepared by – Hemanth Reddy, August 2023

You must be logged in to post a comment.